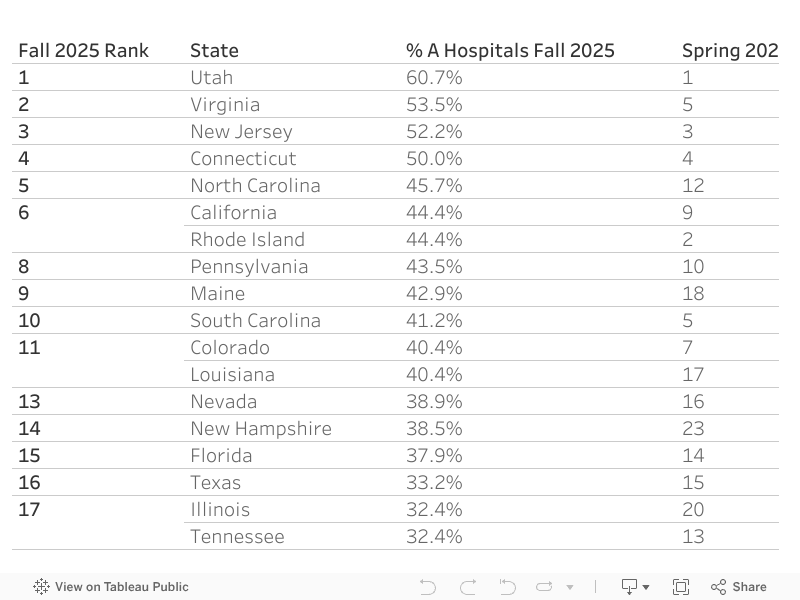
How Safe is Your Hospital?
 

State Rankings

Does your state make the grade? Hospitals across the country show a lot of variation when it comes to patient safety.

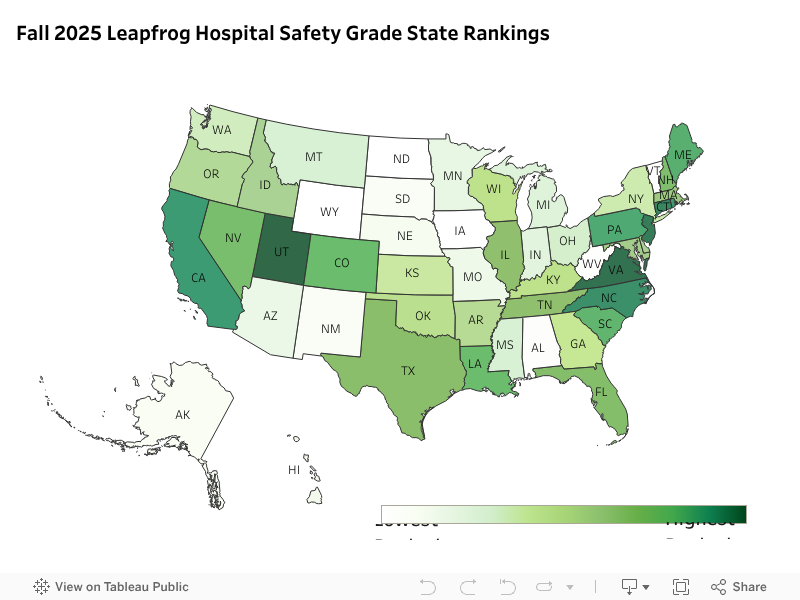
States are ranked based on the number of “A” hospitals they have in spring 2023. The table also includes the total number of "A" hospitals from fall 2022. Click here for a printable version.

Spring 2023  Ranking State % A Hospitals          Spring 2023 Fall 2022
Ranking
% A Hospitals
Fall 2022
1 New Jersey 51.5% 6 47.1%
2 Idaho 50.0% 4 50.0%
3 Utah 48.1% 3 51.9%
4 Pennsylvania 46.5% 9 40.9%
5 Connecticut 42.9% 31 25.0%
6 North Carolina 42.0% 7 44.2%
7 South Carolina 41.2% 21 29.4%
8 Colorado 40.9% 4 50.0%
9 Virginia 38.6% 2 52.1%
10 Massachusetts 36.8% 13 34.5%
11 Florida 35.4% 10 39.3%
12 California 33.8% 25 28.2%
13 Rhode Island 33.3% 16 33.3%
14 Texas 33.2% 14 34.1%
15 Tennessee 32.4% 15 33.8%
16 Minnesota 31.1% 18 32.6%
17 New Hampshire 30.8% 1 53.8%
18 Missouri 30.6% 34 22.2%
19 Washington 30.4% 12 34.8%
20 Kansas 30.3% 24 28.6%
21 Montana 30.0% 20 30.0%
22 Louisiana 27.9% 22 29.3%
23 South Dakota 27.3% 44 10.0%
24 Michigan 26.8% 19 32.5%
24 Mississippi 26.8% 22 29.3%
26 Ohio 26.7% 26 28.0%
26 Indiana 26.7% 27 26.7%
28 Illinois 26.1% 28 26.5%
29 Wisconsin 26.1% 41 11.9%
30 Hawaii 25.0% 16 33.3%
31 Georgia 24.4% 30 25.6%
32 Oregon 24.2% 11 38.2%
33 Maine 23.5% 8 43.8%
34 Arkansas 22.6% 31 25.0%
35 Maryland 22.0% 35 19.5%
36 Oklahoma 20.5% 33 23.3%
37 Nevada 16.7% 29 `26.5%
37 Alaska 16.7% 37 16.7%
37 Vermont 16.7% 49 0.0%
40 Alabama 11.3% 39 12.7%
40 New York 11.3% 39 12.7%
42 Wyoming 11.1% 42 11.1%
43 New Mexico 10.5% 44 10.0%
44 Arizona 10.0% 43 10.2%
44 Nebraska 10.0% 46 5.3%
46 Kentucky 6.6% 36 18.3%
47 Iowa 6.1% 48 3.1%
48 West Virginia 4.5% 47 5.0%
49 Delaware 0.0% 38 14.3%
49 North Dakota 0.0% 49 0.0%
49 Washington, D.C. 0.0% 49 0.0%